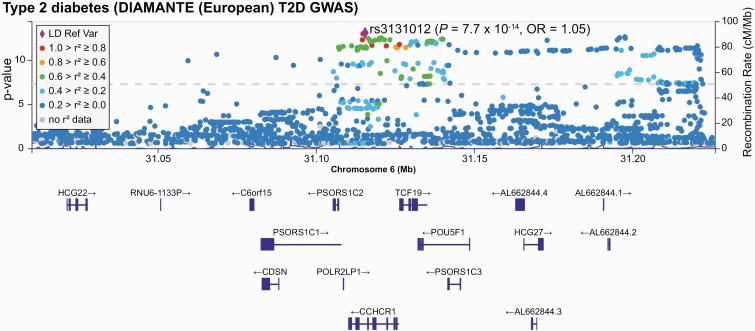
Figure 1.
Regional association plot of the type 2 diabetes association at chromosome 6p21.33 (location of coiled-coil α-helical rod protein 1 [CCHCR1]). Single-nucleotide variations (SNVs, formerly single-nucleotide polymorphisms [SNPs]) are plotted by position on chromosome 6 (x-axis) against association with type 2 diabetes from DIAMANTE (–log10 P value). The strongest signal at SNV rs3131012 is denoted by the purple diamond. Other SNVs are color-coded to reflect their linkage disequilibrium with the top SNV. The location and the direction of transcription for genes in the region are shown below the x-axis.

