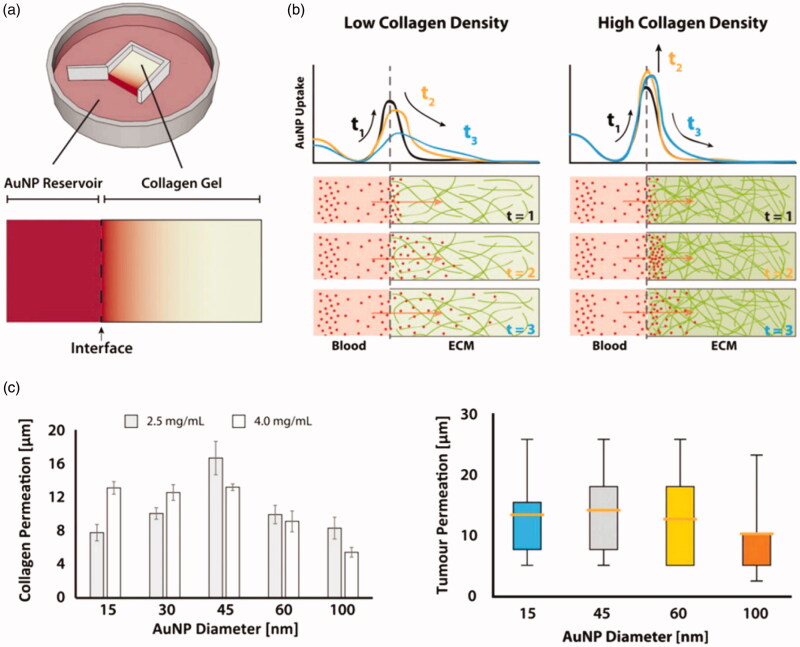
Figure 3.
(a) Schematic diagram depicting in vitro collagen model of AuNP transport through tumor ECM and illustration of the observed AuNP (red) infiltration process in collagen hydrogels (green). (b) The permeation of AuNPs within the collagen hydrogels after 900 mins exposure. (c) Whisker plots depicting the cumulative penetration of AuNP from blood vessels into tumor tissues (Sykes et al., 2016).

