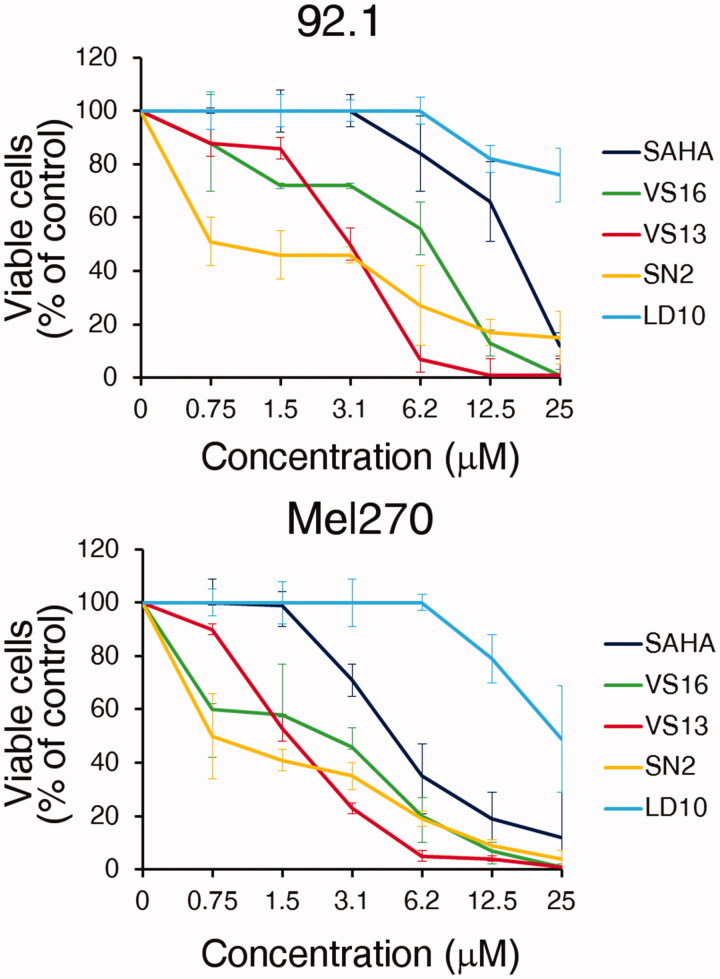
Figure 7.
MTT. In vitro cytotoxicity at the 72 h time point of the different compounds in human UM cell lines 92.1 and Mel270, as assessed by the MTT cell viability assay. Data are expressed as percent of control with the DMSO solvent, which was used at the same amount present in the highest compound concentration. Error bars represent SD of quadruplicates. One representative experiment is shown.

