
Table 1.
Inhibition of tau and Aβ42 aggregation and BACE1 by compounds 1–16 (series I).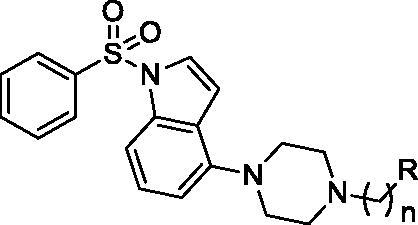
| Cmpd. | n | R | In cellulo tau inhibition %a | In cellulo Aβ42 inhibition %a |
hBACE1 %b or IC50c (μM) |
|---|---|---|---|---|---|
| 1 | 2 |  |
58.1 ± 4.8 | 40.7 ± 4.3 | 1.58 ± 0.15 |
| 2 | 5 | ndd | ndd | 8.07 ± 0.15 | |
| 3 | 6 | 37.6 ± 2.4 | 29.7 ± 4.0 | 7.31 ± 0.24 | |
| 4 | 7 | 46.4 ± 5.9 | 58.8 ± 4.2 | 1.31 ± 0.06 | |
| 5 | 8 | 52.7 ± 5.7 | 61.8 ± 4.1 | 2.29 ± 0.13 | |
| 6 | 2 |  |
54.6 ± 6.2 | 64.8 ± 3.4 | 67.4% ± 4.8 |
| 7 | 3 | 39.7 ± 3.8 | 48.3 ± 4.2 | 5.82 ± 0.34 | |
| 8 | 4 | 45.1 ± 5.1 | 54.5 ± 3.8 | 19.66 ± 1.54 | |
| 9 | 5 | 44.8 ± 5.6 | 48.0 ± 4.0 | 23.38 ± 1.60 | |
| 10 | 2 |  |
43.8 ± 5.6 | 18.1 ± 2.7 | 19.49 ± 1.18 |
| 11 | 3 | 32.5 ± 5.2 | 16.3 ± 3.3 | 54.2% ± 8.1 | |
| 12 | 5 | 39.2 ± 4.5 | 41.4 ± 1.3 | 50.6% ± 10.0 | |
| 13 | 2 |  |
52.7 ± 4.2 | 24.3 ± 3.0 | 6.73 ± 0.47 |
| 14 | 2 |  |
34.9 ± 5.6 | 32.0 ± 3.7 | 8.31 ± 0.51 |
| 15 | 3 | 58.9 ± 3.0 | 39.3 ± 3.7 | 60.2% ± 2.9 | |
| 16 | 4 | 62.9 ± 3.5 | 57.2 ± 4.9 | 56.4% ± 6.3 |
a
The percent of inhibition at 10 µM (mean of three experiments ± SEM).
b
The percent of inhibition at 10 µM (mean of three experiments ± SD).
c
Mean of three experiments ± SEM.
d
Not determined.