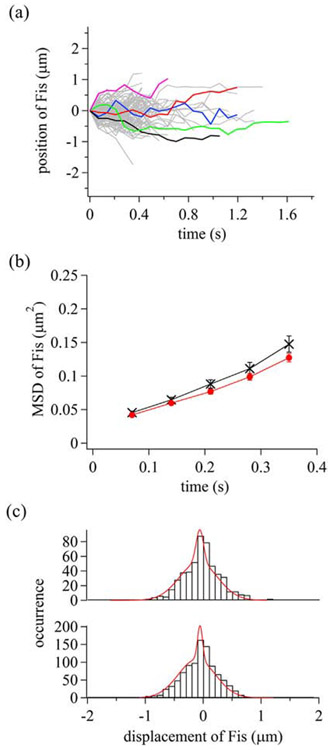
Fig. 4.
Dynamic properties of Fis along DNA. (a) Single-molecule trajectories of mobile Fis molecules in the presence of 150 mM KGlu. Some trajectories were colored to better visualize individual tracks. (b) Time courses of MSD of Fis. Black crosses and red circles are data in the presence of 150 and 200 mM KGlu, respectively. The errors are standard errors. (c) Displacement distribution of Fis at time intervals of 280 ms. Red curves are the best-fitted curves based on the sum of two Gaussian functions. Top and bottom panels represent the data in the presence of 150 and 200 mM KGlu, respectively.

