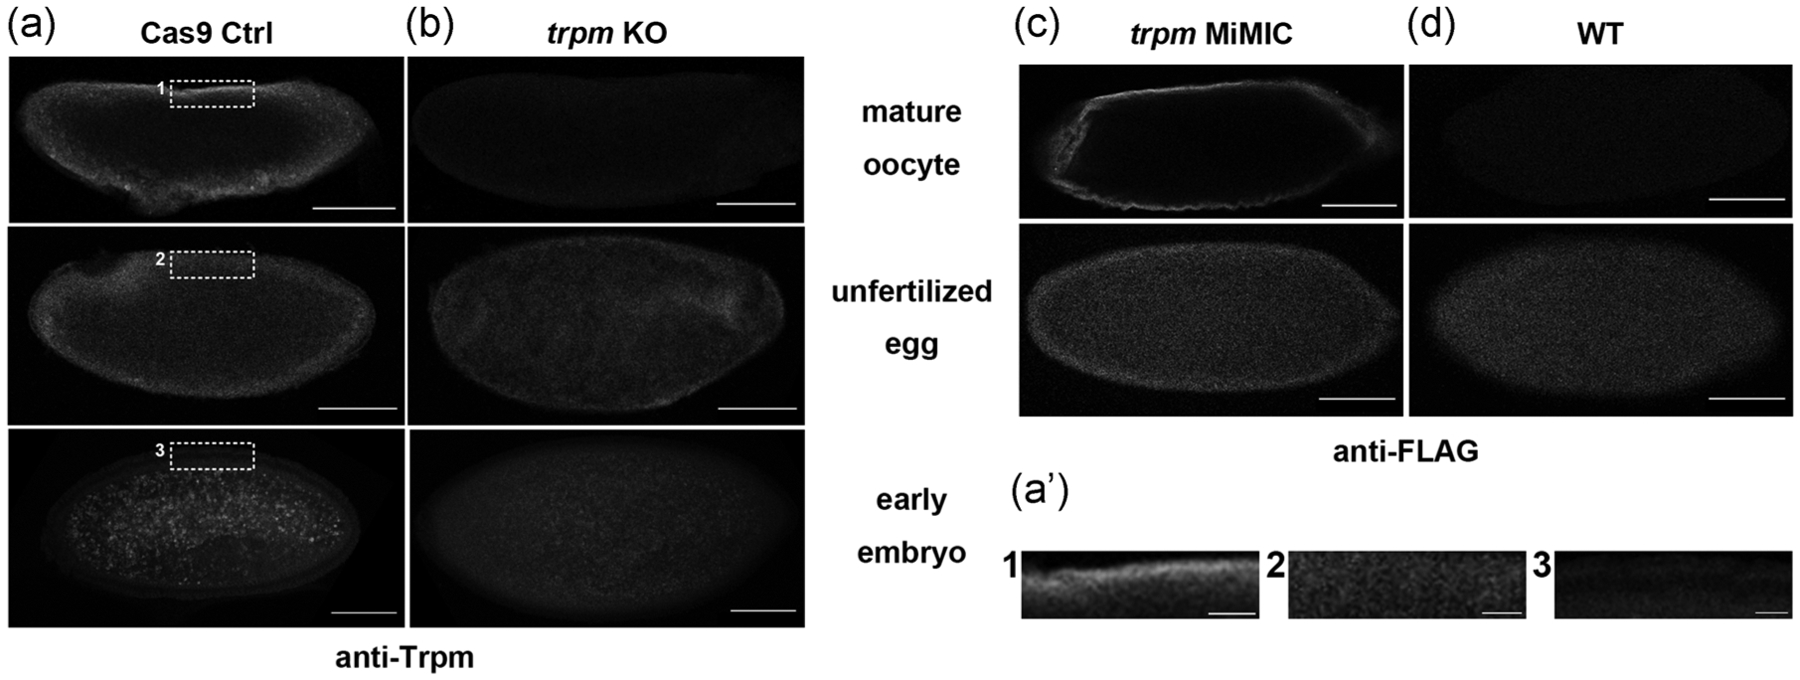
FIGURE 1.

Localization of Trpm before and after egg activation. (a, b) Representative images of anti-Trpm staining of mature oocytes (n = 16 for control [Ctrl], n = 15 for trpm KO), unfertilized eggs (n = 10 for Ctrl, n = 10 for trpm KO) and 1–5 hr early embryos (n = 13 for Ctrl, n = 9 for trpm KO) from (a) matα-GAL4-VP16 > UAS-Cas9 control females and (b) matα-GAL4-VP16 > UAS-Cas9; trpm-gRNA1 trpm germline knockout females (trpm KO); scale bar = 100 μm. (a’) Enlarged view of samples in (a). Dashed lines indicate enlarged region; scale bar = 50 μm. (c,d) Representative images of anti-FLAG staining of mature oocytes (n = 9 for trpm MiMIC, n = 8 for WT) and unfertilized eggs (n = 11 for trpm MiMIC, n = 7 for WT) from trpm MiMIC insertion females and ORP2 wildtype females; scale bar = 100 μm. Images are single optical slices through the center of the oocytes. The oocytes shown were taken from the ovaries of different flies, but results were consistent across all ovaries, in two independent replicates. Similar background signals were seen in unfertilized eggs and early embryos
