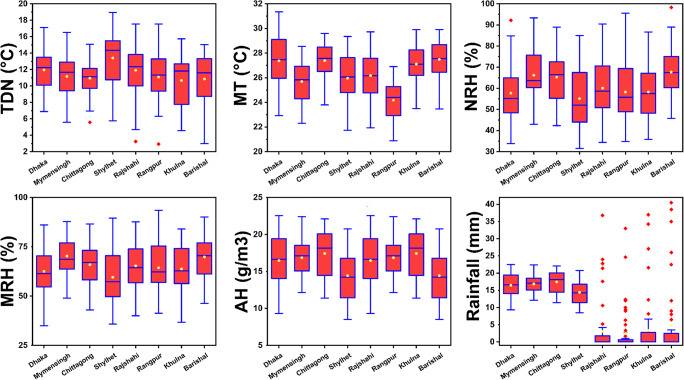
Fig. 4.
Temporal variation of meteorological variables in eight divisions of Bangladesh. Boxplots represent the distance between the first and third quartiles while whiskers are set as the most extreme (lower and upper) data point where the yellow and red points represent median and outliers respectively

