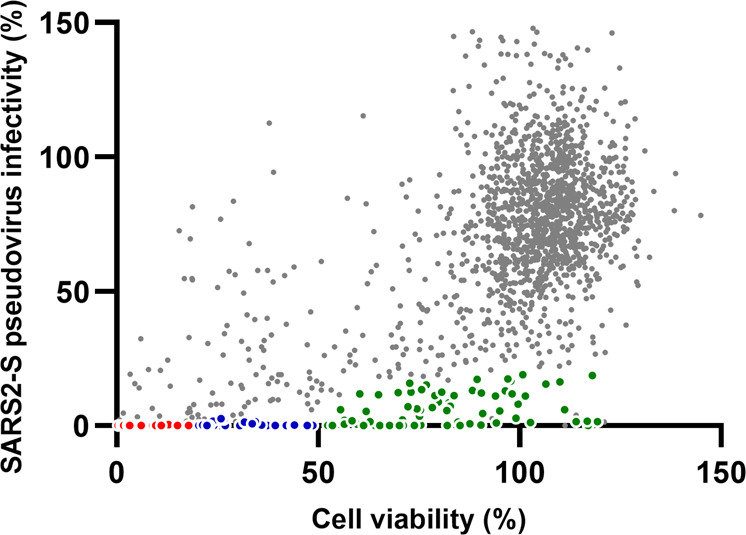
Fig. 2. Results of primary high throughput screening.

Data from the primary screening experiments using the library of 1800 approved drugs were plotted as the cell viability (%) vs SARS2-S pseudovirus infectivity (%) in Huh-7 cells. Cell viability was calculated as a percentage of the OD@570 readout by the MTT method for each well against that of the control well with no drug. Infectivity was calculated in the same way using a luciferase activity readout. Compounds that met different primary criteria were plotted in color (Red: 20% ≥viability, viability/infectivity ≥20; Blue: 50% ≥viability ≥20%, viability/infectivity ≥10; Green: viability ≥50%, viability/infectivity ≥5).
