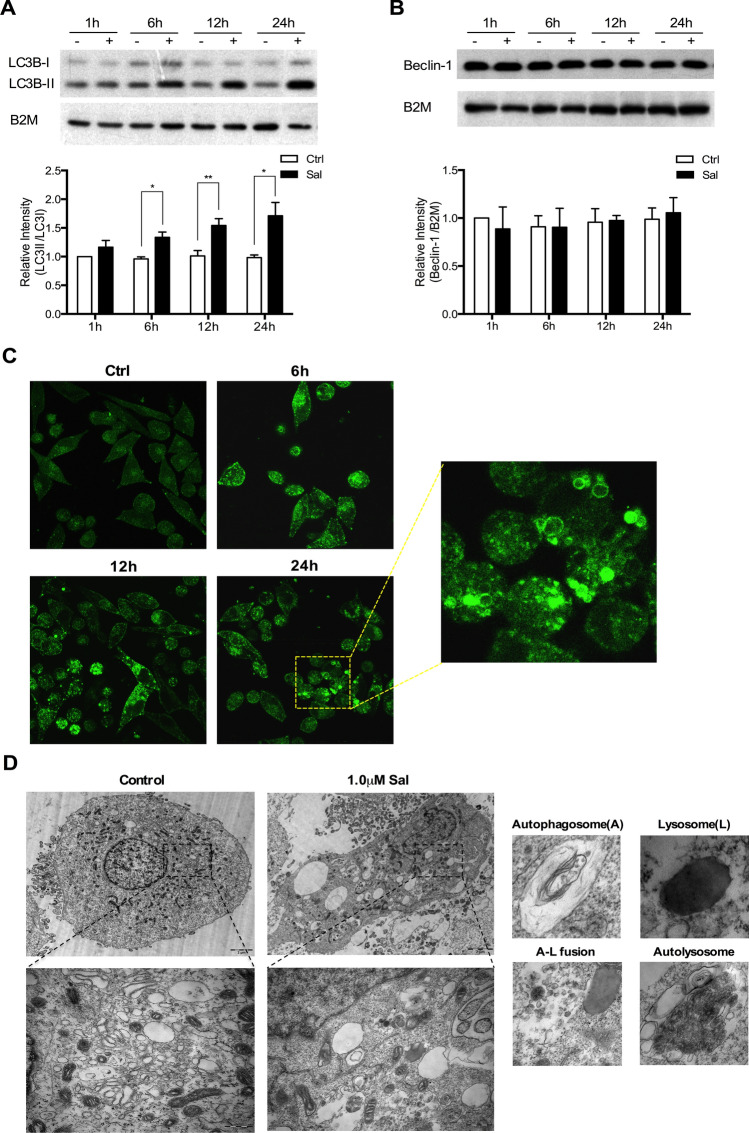
Figure 3.
Increase of autophagic markers in Sal-treated cells. (a) Samples from DMSO-treated control and Sal-treated (1.0 μM) cells immunoblotted for LC3B (*p < 0.05; **p < 0.01; n = 3). (b) Samples from DMSO-treated control and Sal-treated (1.0 μM) cells immunoblotted for Beclin-1 (n = 3). (c) SK-MEL-19-GFP-LC3B cells were treated with 1.0 μM Sal for the indicated period. (d) TEM images of SK-Mel-19 cells treated with or without 1.0 μM Sal for 24 h. Individual portraits of autophagosomes and lysosomes were represented in the subpanel along with the images showing autophagosome, lysosome fusion and autophagolysosome.

