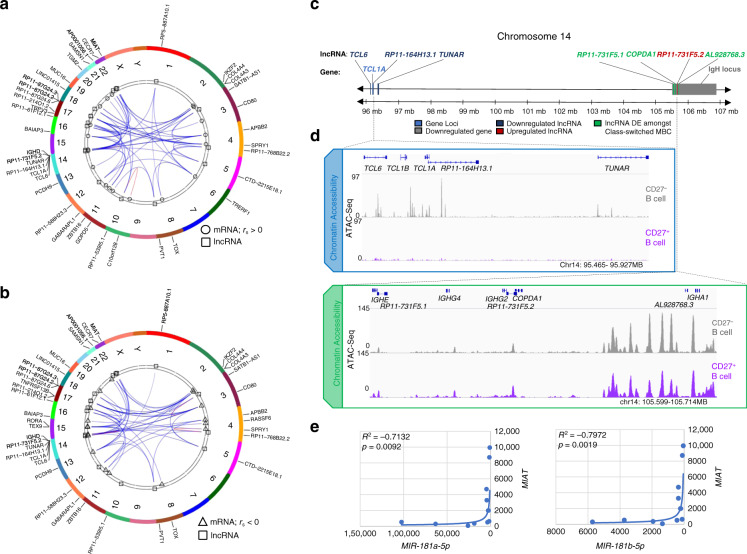
Fig. 10. Characterization of the human MBC lncRNA profile.
a, b lncRNA-to-mRNA co-expression correlations depicted as Circos plots with human chromosomal ideograms (various colors). lncRNA-to-mRNA correlations showing 21 DE lncRNAs (Δ abundance>100; depicted as squares) in swMBCs and the top three positively (a circles, rs > 0) correlated mRNAs and top three negatively (b triangles, rs < 0) correlated mRNAs for each lncRNA with p < 0.05 (Pearson correlation). c Schematic of the terminal end of chromosome 14 (q32.2–q32.3), depicted with DE mRNAs, lncRNAs, and critical B cell gene loci annotated. DE mRNAs and DE lncRNAs in swMBCs, as well as differences in genetic loci between CD27+IgG+ swMBCs, CD27+IgA+ swMBCs, and CD27–IgD+ NBCs are depicted. Downregulated lncRNAs (dark blue), upregulated lncRNAs (dark red), DE lncRNAs between swMBCs (green), downregulated mRNA (light blue), and the IgH locus (gray). d Chromatin accessibility upstream and in the human IgH loci is displayed by IGV gene track. Coverage includes gene and lncRNA introns, exons, promoter regions, and potential enhancer regions. ATAC-Seq signal is normalized for the window of interest, with NBCs depicted in gray and total MBCs in purple. e Correlations between expressed miRNAs and MIAT as calculated across all sorted subsets (n = 12) by Spearman’s rank correlation.

