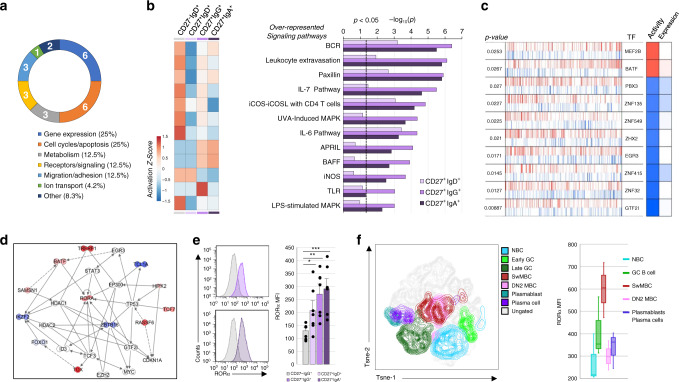
Fig. 5. Functional characterizations of the swMBC core transcriptional signature.
a Functional gene ontology annotation of the 24 DE genes at padj < 10 × 10−30 in swMBCs vs. NBCs (swMBC core transcriptional signature). Numbers denote genes in each category. b Canonical pathways in swMBCs and unswMBCs displaying significant increases or decreases in activation status were determined by IPA, with −log10-transformed p shown on the x axis (p < 0.05 indicated by the dashed line). Activation Z-scores of pathways in each subset are shown by heatmap color-coded according to legend: increased activation, red; decreased activation, blue. c SwMBC transcriptional regulators as identified by the MARINa algorithm, which is measured using as differentially expressed target odds ratio90. Gene expression is rank-ordered from the most downregulated to the most upregulated gene in swMBCs. In each row, the transcription factor (TF) names are given; positive (activated; red bars) and negative (repressed; blue bars) targets of the regulator have plotted along with the gene expression signature in rank order. The first column on the right depicts inferred differential activity of the regulator (Activity), while the second shows the regulator differential expression (expression). d IPA network analysis indicating annotated interactions between MARINa-inferred TFs, nucleus-localized DE swMBC signature genes, and IPA-identified cofactors. CD27+IgG+ and CD27+IgA+ B cell data sets are overlaid on the IPA network, depicting upregulated genes in red and downregulated genes in blue. e RORα expression in CD27-IgD+, CD27+IgD+, CD27+IgG+, and CD27+IgA+ B cells from peripheral blood of seven healthy human donors, as analyzed by intracellular staining followed flow cytometry. *p < 0.05, **p < 0.01, ***p < 0.001, ns not significant (paired two-sided t-test). Data are mean ± SEM of three independent experiments. f RORα expression in B cell fractions from the tonsil of three human subjects, as analyzed by intracellular staining followed flow cytometry. Fractions analyzed comprise NBCs (CD19+CD38−CD27−IgD+CD138−; blue), GC B cells (CD19+CD38loCD27+/−IgD+/−CD138−; green), swMBCs (CD19+CD38−CD27+IgD−CD138−; red), DN2 MBCs (CD19+CD38−CD27−IgD−CD138−; pink), plasmablasts and plasma cells (CD19+/−CD38hiCD27+IgD−CD138+/−; purple). Data are represented as boxplots where the middle line is the median, the lower and upper hinges correspond to the first and third quartiles, the upper whisker extends from the hinge to the largest value no further than 1.5 × IQR from the hinge (where IQR is the inter-quartile range) and the lower whisker extends from the hinge to the smallest value at most 1.5 × IQR of the hinge. Quantification of RORα MFI in e (n = 7) and f (n = 3). B cell subsets; CD27–IgD+ (gray), CD27+IgD+ (lavender), CD27+IgG+ (purple), and CD27+IgA+ (dark purple).

