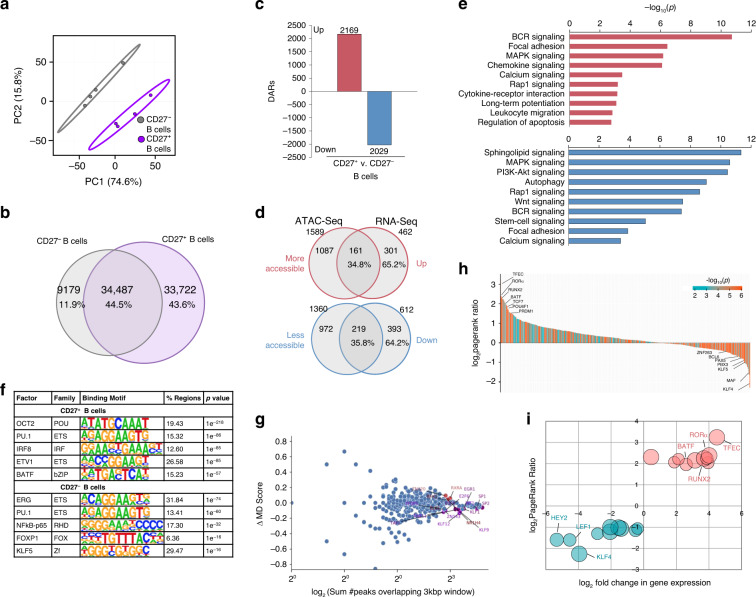
Fig. 6. The chromatin landscape of human MBCs.
a Clustering of CD27– NBCs and CD27+ total MBCs based on top differentially accessible loci as displayed by PCA (4198). Prediction ellipses define 95% confidence intervals. Each symbol represents an individually sorted subset (n = 4). b Overlap of accessible loci between NBCs and total MBCs depicted by Venn diagram. c Differential chromatin accessibility (p < 0.05) between total MBCs and NBCs as determined by DEseq2. Differentially accessible regions (DARs) with increased (red) or decreased (blue) accessibility depicted by histograms. d Proportion of DE genes that overlap with DARs, as depicted by Venn diagrams. Percentage of genes exhibiting corresponding increases/decreases in chromatin accessibility shown below the number of genes. e Statistically over-represented KEGG pathways associated with increased (red) or decreased (blue) DARs depicted by the histogram. f Significant TF- binding motifs enriched in NBC- or all MBC-specific open chromatin regions as determined by HOMER motif analysis. g For all motifs (dots), the changes in MD score between NBCs and total MBCs (y-axis) are (MA) plotted against the number of motifs within 1.5 kb of any ATAC-Seq peak center (x axis)—computed by DAStk94. Red points depict statistically significant increased MD-scores (p < 0.05). h, i RNA-Seq and ATAC-Seq data sets were integrated using the Taiji PageRank algorithm92 to generate PageRank activity scores and p-values for human TFs. h All 421 TFs (p < 0.05) plotted in rank order according to their log2PageRank score ratio between MBCs vs. NBCs. Each TF PageRank −log10(p) is denoted by color-coding according to legend: more significance, red; less significance, blue. i The top 10 TFs in NBCs and top 10 TFs in MBCs was plotted according to their log2PageRank score ratio and log2fold change in transcript expression in MBCs vs. NBCs. The bubble size of each TF is determined by the −log10(p) of Taiji analysis.

