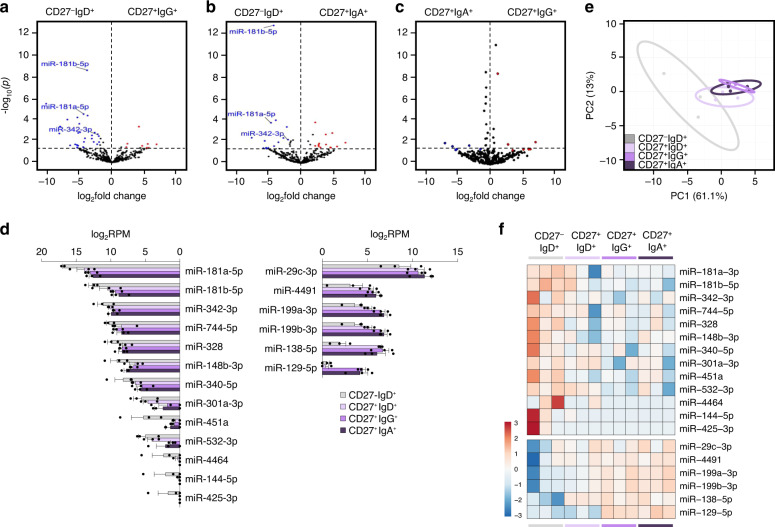
Fig. 7. Altered expression of the miRNA profile in human swMBCs.
a–c Global transcriptional differences of miRNAs in CD27+IgG+ vs. CD27–IgD+ B cells (a), CD27+IgA+ vs. CD27–IgD+ B cells (b), and CD27+IgG+ vs. CD27+IgA+ B cells (c) as depicted by volcano plot. All miRNAs annotated in human GENCODE v24 GRCh38 are shown, with each circle representing 1 miRNA. −Log10-transformed p is shown on the y axis (p < 0.05 indicated above dashed line). DE miRNAs at p < 0.05 are highlighted in red (upregulated) or blue (downregulated). DE miRNAs at p < 0.05 (with Δ abundance > 1000) shared by CD27+IgG+ and CD27+IgA+ are annotated. d Normalized (log2RPM) expression of the 19 DE miRNAs at p < 0.05 in swMBCs as compared to NBCs depicted by histogram for each B cell subset. Data are mean ± SEM of all three subjects. e Transcriptome clustering of the sorted subsets performed using the 19 DE miRNAs depicted by the PCA plot. Prediction ellipses define 95% confidence intervals. Each symbol represents an individually sorted subset (n = 3). f Relative expression profiles of swMBC core transcriptional signature miRNAs at p < 0.05 compared by heatmap, depicting relative transcriptional changes across CD27–IgD+, CD27+IgD+, CD27+IgG+ and CD27+IgA+ B cell subsets in each subject (order; B, C, G). Data in a–f depict DE miRNAs as determined by edgeR. B cell subsets; CD27–IgD+ (gray), CD27+IgD+ (lavender), CD27+IgG+ (purple), and CD27+IgA+ (dark purple).

