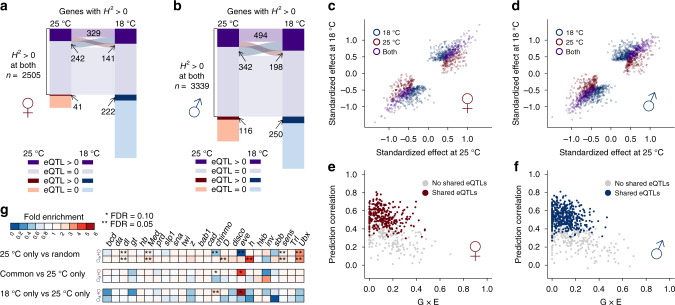
Fig. 4. Plasticity of regulatory variation in gene expression.
Sharing of genes with eQTLs between 25 and 18 °C in females (a) and males (b). The numbers indicate genes only. Each colored box represents the number of genes in each category, with the category indicated on the bottom left, where eQTL > 0 indicates genes with mapped eQTLs while eQTL = 0 indicates genes without mapped eQTLs. Boxes with the same colors (dark and light purple) are genes that are genetically variable at both temperatures. The extent of sharing is proportional to the width of the ribbons connecting the boxes. eQTL effect comparison between 25 and 18 °C in females (c) and males (d). Cross-environment prediction of gene expression using eQTLs in females (e) and males (f). Gene expression at 18 °C was predicted based on eQTLs mapped at 25 °C and the prediction was evaluated by Pearson correlation between the observed and predicted expression. The prediction correlation is plotted against G×E. g Enrichment/depletion of transcription factor binding sites overlap among eQTLs. The enrichment was computed based on the ratio over the mean of overlap among 10,000 randomly drawn sets of eQTLs with the same numbers across the three classes (25 °C only, 18 °C only, and common). The P value for enrichment was computed based on the number of iterations that was more extreme (one-sided, enrichment or depletion) than the observed overlap and adjusted using the Benjamini–Hochberg approach.

