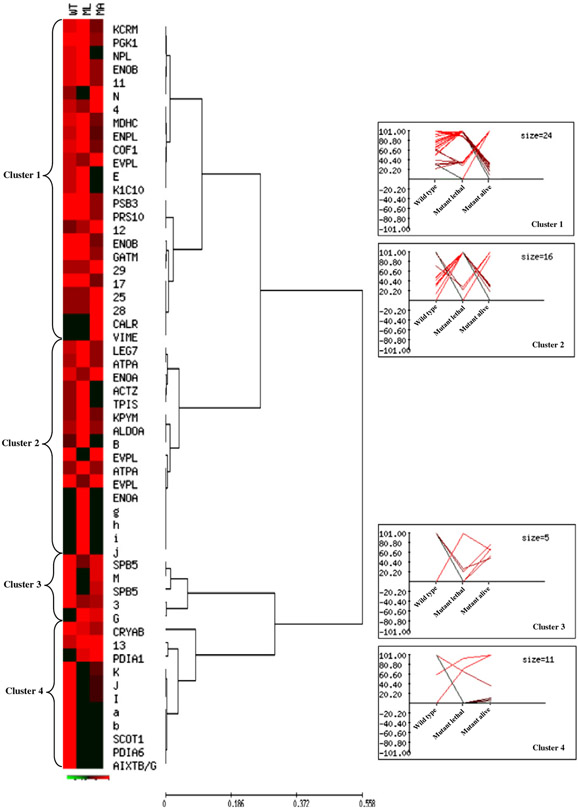
Fig. 3 –
Unsupervised multivariate analysis: Hierarchical Clustering. Normalized %V mean values of qualitative and quantitative differences, as computed in WT, ML, and MA spot maps, are visualized by expression matrix, where each reported %V value is proportional to the intensity of the color. Corresponding spot identity (protein name, as listed in Tables 1-2, and number or letter for not identified spots) is annotated on the right of the diagram, near the dendrogram of the average linkage clustering based on Pearson distance. The proteins were grouped into four major clusters, which are numbered from top to bottom. Expression profiles of proteins from each cluster are shown on the right of the dendrogram.

