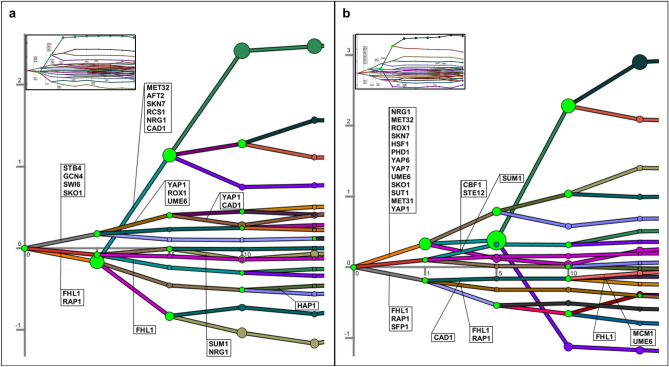
Figure 6.
Dynamic re-organization of the transcriptional response to copper impulse (a) in the reference and (b) CCC2 deleted strain. Green nodes represent bifurcation points, and the time points which were not scaled based on real time correspond to 0th, 1st, 5th, 10th, and 15th min, respectively. The small graphs represent the overall response including 0th, 1st, 5th, 10th, 15th, 20th, 25th, 30th, 60th, 120th min. Node sizes represent deviation of gene expression from the model. These figures were generated by using DREM software27 (https://sb.cs.cmu.edu/drem/) version 2.0.3.

