Figure 1.

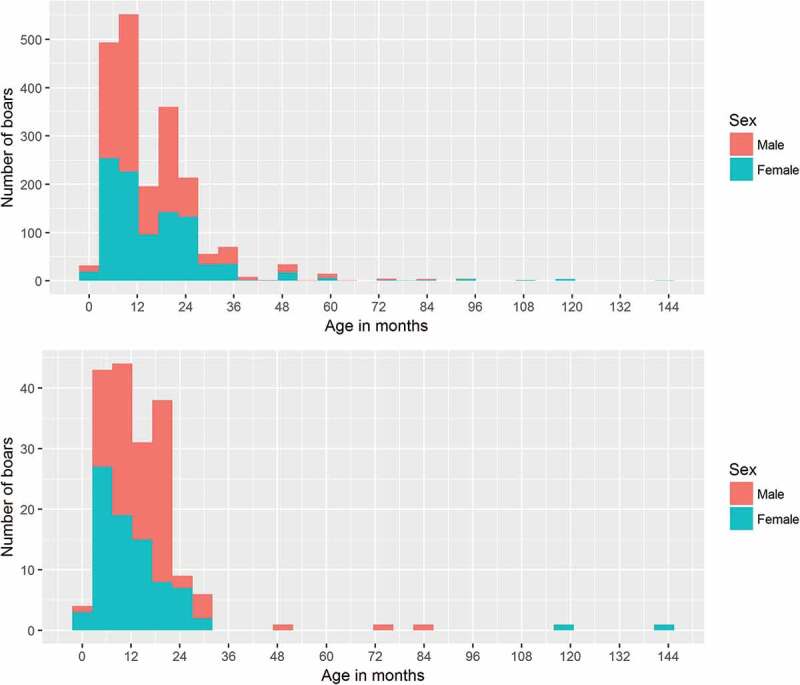
Age distribution of sampled hunted wild boars. Upper graph (a) shows the age distribution from all boars from which a serum sample was tested. Lower graph (b) shows the age distribution from all boars from which a tonsil sample was tested

Age distribution of sampled hunted wild boars. Upper graph (a) shows the age distribution from all boars from which a serum sample was tested. Lower graph (b) shows the age distribution from all boars from which a tonsil sample was tested