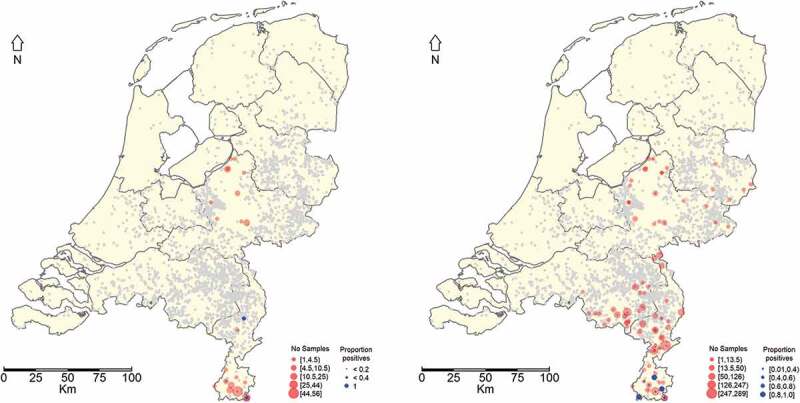
Figure 2.

Geographical distribution of hunted wild boars from which tonsil samples were taken and observed RT-PCR results (blue dots) expressed as fraction positives (left panel). Geographical distribution of hunted wild boars from which serum samples were taken and observed ELISA test results (blue dots) expressed as fraction positives (Right panel). If no blue dot is observed then no positive result was obtained. The grey dots represent Dutch pig farms
