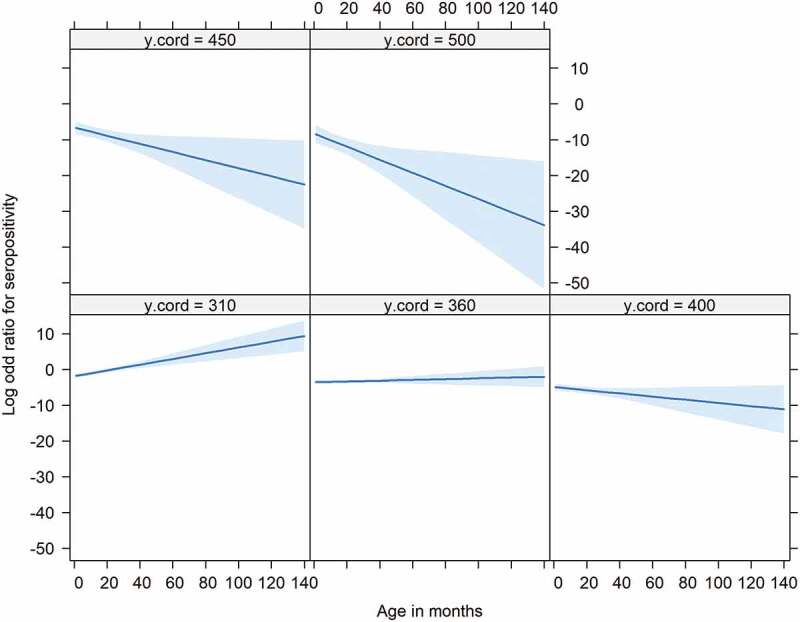
Figure 4.

Relationship between age (X axis), odds for seropositivity (Y axis) and south-north geographic location (Facets). Facets show Y coordinates (‘y.cord’) stratified by 50 Km intervals. The higher the Y coordinate the norther the location. There is a positive increase in the odds for seropositivity with age (the older the animal the higher the odds for serpositivity) in the southern part (y coordinates ≤ 360 Km) of The Netherlands. This relationship changes in the northern regions (Y coordinates >360) with the odds for seropositivity decreasing with age (odds for seropositive higher in younger animals than older animals)
