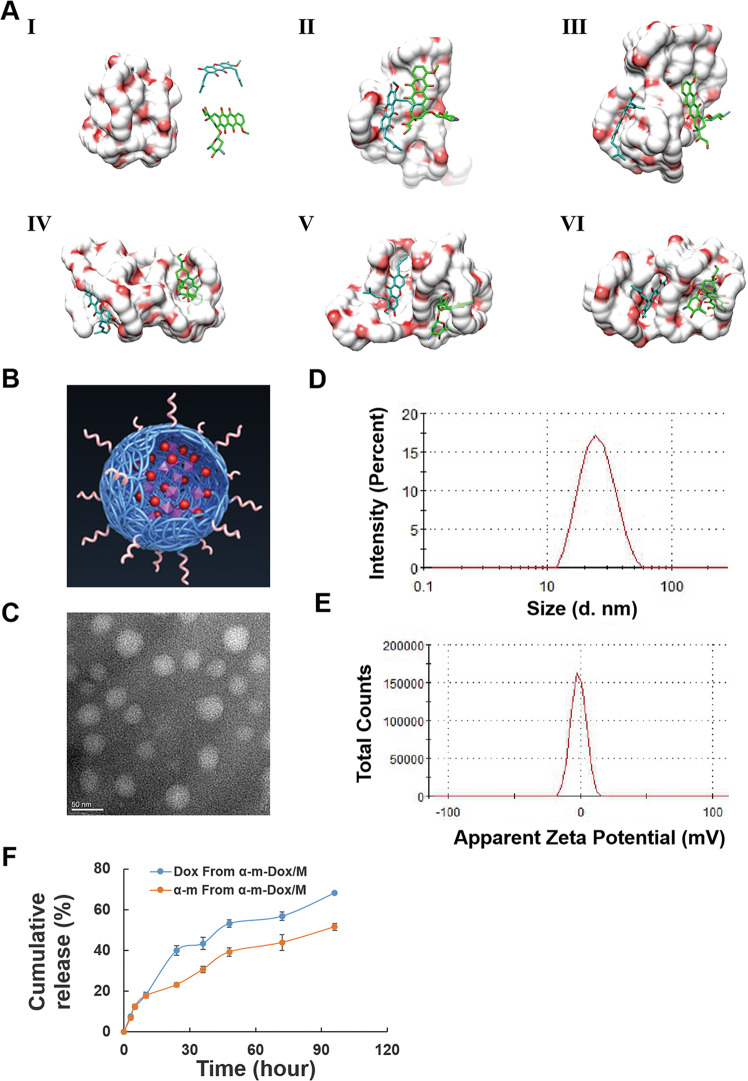
Fig. 1. Computational simulation analysis and characterization of nanocomposites.
a Interaction modes of the MPEG-PCL copolymer, α-m and Dox revealed by Langevin dynamics simulations. The nanocomposite is depicted with a solid surface. (I) The initial conformation of the MPEG-PCL copolymer complexed with α-m and Dox. The left, upper right and lower right represent the MPEG-PCL copolymer, α-m and Dox, respectively. Conformations (II), (III), (IV), (V) and (VI) correspond to snapshots of the nanocomposite collected at 100, 200, 300, 400 and 500 ps, respectively. b Structure of the model of α-m-Dox/M. c TEM image of α-m-Dox/M. d Size distribution spectrum of α-m-Dox/M. e Zeta potential of α-m-Dox/M. f In vitro release study of α-m-Dox/M.

