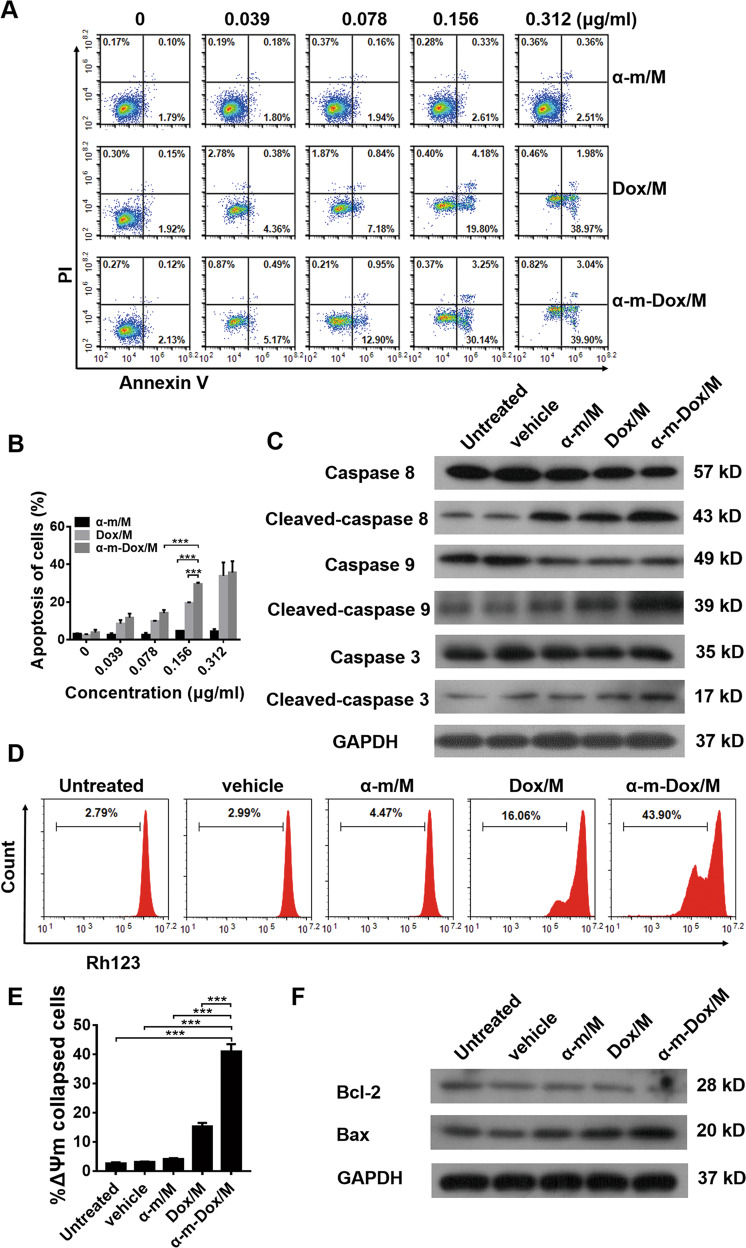
Fig. 3. Apoptosis assay.
Gl261 cells were incubated with different nanocomposites at different concentrations for 48 h. Cells were collected and stained with Annexin-V and PI. The concentrations of the nanocomposites were 0, 0.039, 0.078, 0.156 and 0.312 μg/ml. (a, b) Percent of apoptotic cells. Gl261 cells incubated with different nanocomposites for 48 h were collected for Western blot analysis. c Western blot of apoptosis-related proteins. Gl261 cells were incubated with different nanocomposites (0.156 μg/ml) for 48 h. Cells were collected and stained with Rh123. In addition, cells were collected for Western blot analysis. (d, e) Changes in mitochondrial membrane potential (ΔΨm). f Western blot analysis of mitochondrial apoptosis-related proteins. Data are presented as the mean ± s.e.m. and are representative of at least three independent experiments performed in quintuplicate cultures. *p < 0.05, **p < 0.01, ***p < 0.001; ANOVA and Student’s t-test.

