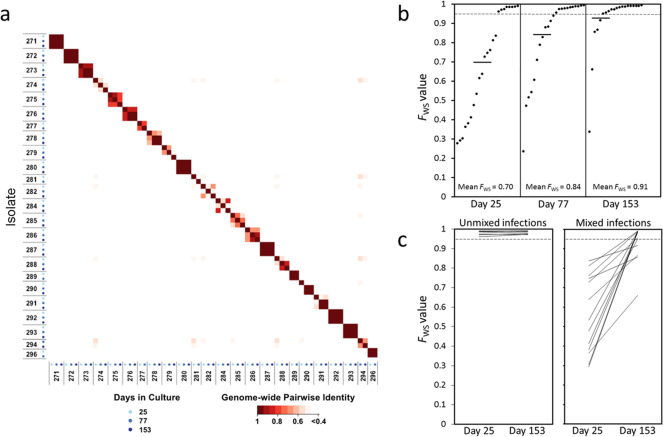
Fig. 2. Parasite genome sequence profiles within P. falciparum clinical isolates analysed over time in culture.
a Matrix of pairwise comparisons indicates the degree of identity between genomic profiles of parasites at different times in culture. The identity index is calculated from the within-sample allele frequencies of 40,000 high-quality SNPs distributed throughout the 14 chromosomes of the parasite genome. Axes are labelled with the parasite isolate identifiers and the sequential cultured timepoints having different shaded blue dots. As expected, all isolates were different from each other throughout, and some had genomic profiles that remained the same over time while others showed some changes during culture. Sequence accession numbers for all sample timepoints are given in Supplementary Table S1, and genome-wide sequence coverage data are given in Supplementary Table S2. b Genomic diversity gradually reduced over time in isolates that initially had mixed genotypes. The within isolate genome-wide fixation index FWS is plotted for each timepoint. Low values of FWS indicate isolates with a high level of genomic diversity, and values closer to 1.0 indicate where there is little within-isolate diversity (the dotted line indicates FWS = 0.95 as values above this indicate isolates with a predominant single genotype). Mean values are shown with horizontal bars (0.70 at day 25, 0.83 on day 77, 0.92 on day 153). The FWS values for all isolates at all timepoints are given in Supplementary Table S2. c Comparisons between the first and last timepoints for individual isolates show that single genotype isolates remained unmixed, while all isolates that were mixed at the beginning became less mixed (increased FWS values) by the end of the culture period.

