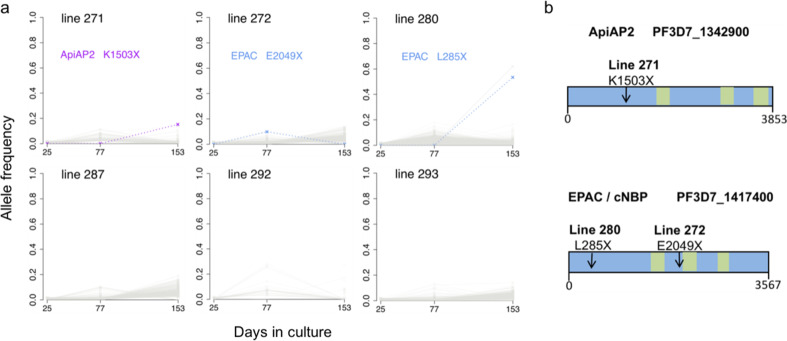
Fig. 3. Selection of novel SNPs during culture adaptation of single-genotype P. falciparum clinical isolate lines.
a Allele frequencies at each sampled time point were determined by alternative sequence read counts for each variant SNP or short indel within each isolate. Novel alleles not detectable at the first time point are plotted, with coloured dashed lines representing nonsense mutants causing premature stop codons, and grey shading representing variant calls that do not affect the integrity of coding sequences. Isolate line 271 had a nonsense mutant in an AP2 gene (locus PF3D7_1342900) detectable by the final timepoint. Line 272 had a nonsense mutant in the EPAC gene (locus PF3D7_1417400) detected at low frequency, while line 280 had another mutant in the EPAC gene detected at higher frequency by the final timepoint. b Gene models with an arrow indicating the mutation position in the AP2 and EPAC genes for each emerging nonsense SNP identified in panel A. Green boxes indicate predicted catalytic and AP2 domains. The numbers of codons in each gene are indicated underneath each scheme (full information on each gene may be accessed on the PlasmoDB browser www.plasmodb.org46).

