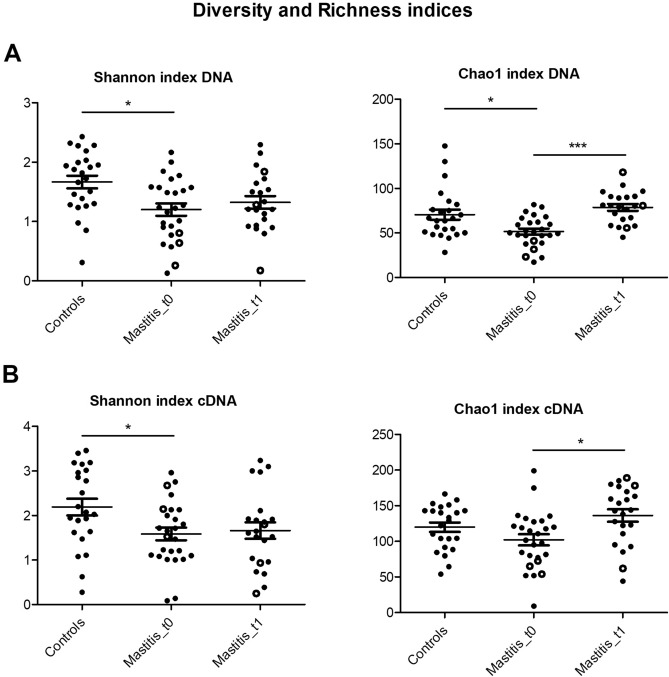
Figure 2.
Bacterial diversity and richness in human milk samples from healthy and mastitis-suffering women. Plots show human milk microbiota genus-level diversity and richness (here presented with Shannon and Chao1 indices), with means and standard errors. (a) Represents microbiota DNA Shannon and Chao1 indices. Controls, n = 24; Mastitis_t0, n = 26; Mastitis_t1, n = 22. (b) Shows microbiota RNA Shannon and Chao1 indices. Controls, n = 23; Mastitis_t0, n = 26; Mastitis_t1, n = 22. Acute mastitis samples are represented with white circles, n = 3. t0 = samples during the course of the symptoms; t1 = samples after symptoms disappeared. *p < 0.05 and ***p < 0.001, non-parametric Kruskal Wallis test. Created in GraphPad Prism 5 v5.04 (www.graphpad.com).

