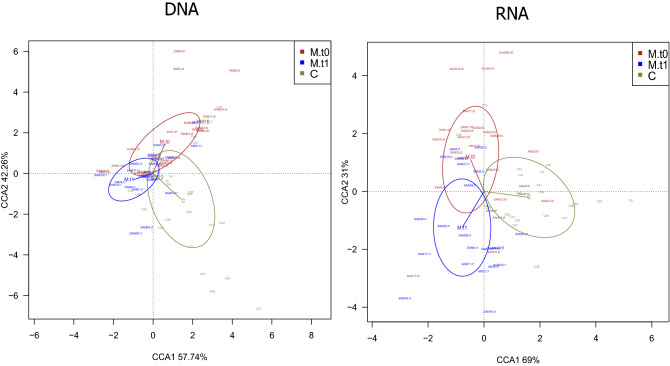
Figure 4.
Human milk microbiota patterns in healthy mothers and mothers suffering lactational mastitis. Constrained correspondence analyses (CCA), which here emphasize variations in microbiota OTU-level patterns, in human milk from healthy mothers and mothers suffering lactational mastitis at two time points, at DNA-level (p = 0.015), and active microbial RNA-level (p = 0.04). The percentage of variation explained by constrained correspondence components is indicated on the axes. t0 = samples during the course of the symptoms; t1 = samples after symptoms cessation. p-values for CCA plots were determined by Adonis, and indicate if health status and/or time can significantly explain data variability. Controls (C): DNA, n = 24; RNA = 23; Mastitis t0: DNA, n = 26; RNA = 26; Mastitis t1: DNA, n = 22; RNA, n = 22. Created in R software v 3.5.1 (2018–07-02) (https://www.R-project.org).

