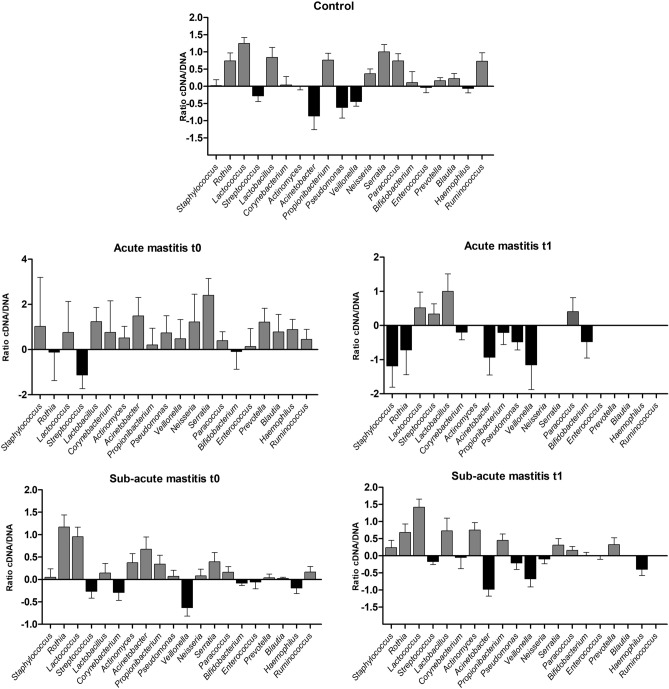
Figure 6.
Average bacterial activity indices in human milk in health and during mastitis. The graph shows average bacterial activity indices, corresponding to the ratio between the proportion of each bacterial genus in the RNA- and DNA-based sequences, and the standard error of the mean (SEM) per groups. Controls, n = 23; Sub-acute mastitis t0, n = 23; Sub-acute mastitis t1, n = 19. Positive ratios are represented in grey, negative ratios in black. Created in GraphPad Prism 5 v5.04 (www.graphpad.com).

