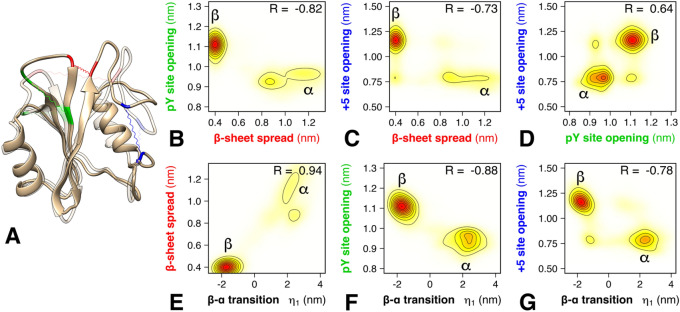
Figure 2.
Conformational states and correlations revealed by the first PCA vector. (A) Conformational transition from β (opaque) to α (transparent), representing the two main conformational states adopted by the N-SH2 domain, here visualized as the extreme projections onto the first PCA vector. The residues used to quantify the β-sheet spread, the pY loop opening, and the + 5 site opening are highlighted in red, green, and blue, respectively. (B–D) Correlation between the β-sheet spread, pY loop opening, and + 5 site opening, as taken from microsecond simulations of N-SH2 bound to 12 different peptides. The distances were defined as described in the main text. (E–G) Correlation between the projection η1 onto the first PCA vector and β-sheet spread, pY loop opening, and + 5 site opening (see axis labels). Pearson correlation coefficients R are shown in each panel (B–G).

