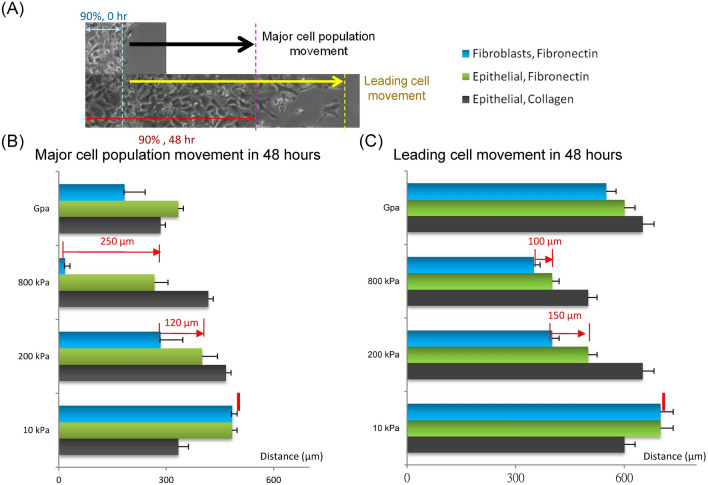
Figure 4.
Comparison of cell motility results for A549 epithelial cells and WI-38 fibroblasts on different substrates: (A) A diagram to indicate “Major cell population movement” and “leading cell distance”. (B) A comparison of cell motility results for the major cell population movement for A549 epithelial cells attached on fibronectin coated PDMS substrates, A549 epithelial cells attached on collagen coated PDMS substrates, and WI-38 fibroblasts attached on fibronectin coated PDMS substrates with stiffnesses including 10 kPa, 200 kPa, 800 kPa and glass. Data are standard deviation. (C) A comparison of cell motility results with the leading cell movement for A549 epithelial cells attached on fibronectin coated PDMS substrates, A549 epithelial cells attached on collagen coated PDMS substrates, and WI-38 fibroblasts attached on fibronectin coated PDMS substrates with stiffnesses from 10 kPa, 200 kPa, 800 kPa and glass. The difference in cell response between the two cell types to substrate stiffness is statistically significant (P values < 10–5 between the epithelial cells and the fibroblasts for both the 90% distribution and the leading cell movement).

