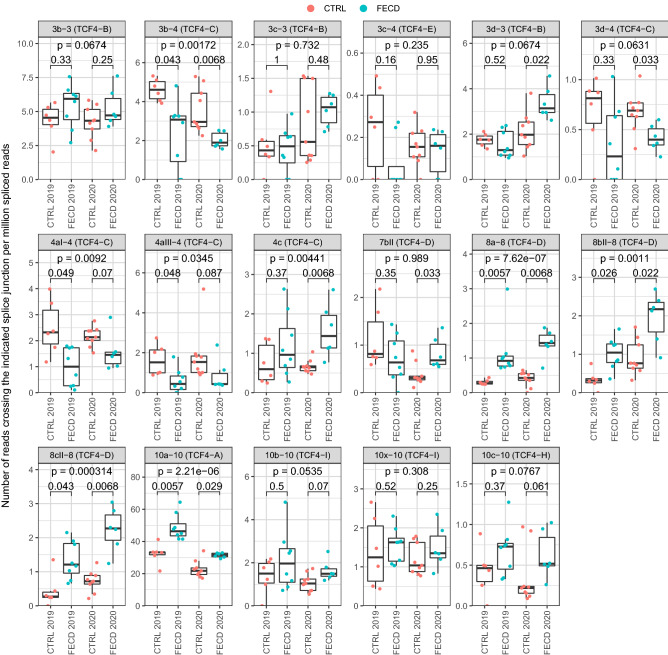
Figure 3.
The expression of TCF4 alternative transcripts containing 5′ exons spliced to exon 4 is decreased in the cornea of FECD patients. Two independent FECD RNA-seq datasets—by Nikitina et al.27 (named 2019 in the figure) and Chu et al.28 (named 2020 in the figure)—were used to analyze the expression levels of TCF4 alternative 5′ exons in corneal endothelium. The expression levels of different TCF4 splicing events were quantified using the number of reads crossing the splice junction (shown above the graphs) normalized with the total number of spliced reads and multiplied by million. The TCF4 protein isoform encoded by the transcripts containing the indicated splicing event is shown in parentheses above the graphs. The data is visualized as box plots—the hinges show 25% and 75% quartiles, the horizontal line shows the median value, the upper whisker extends from the hinge to the largest value no further than 1.5 * inter-quartile range from the hinge, the lower whisker extends from the hinge to the smallest value at most 1.5 * inter-quartile range of the hinge. All data points are shown with dots. The 2019 dataset includes 6 controls and 8 FECD patients with an expanded TCF4 CTG TNR, and the 2020 dataset includes 9 controls and 6 FECD patients with an expanded TCF4 CTG TNR. 10 × –10 is a previously undescribed splicing event. Within-experiment statistical analysis between the CTRL and FECD patients (indicated groups) was done using Mann–Whitney U test, p-values were corrected for multiple testing using false discovery rate. Generalized linear model, followed by Wald test was used to determine statistical significance of the disease state combining data from both 2019 and 2020 experiments, p-values were corrected using FDR (p-value in the upper part of the panel).

