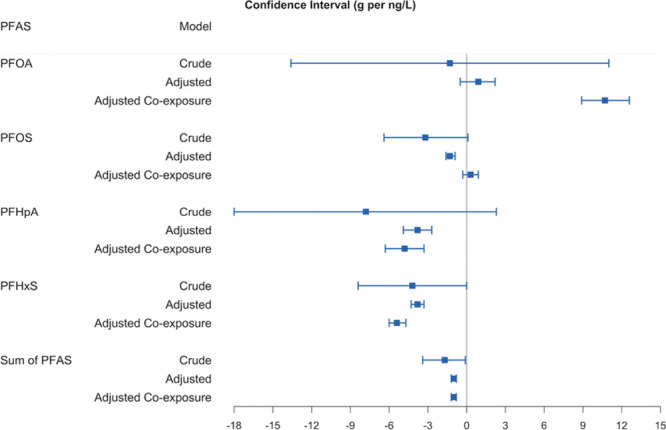
Figure 2.

The change of average birthweight (g) for 1 ng/L increase in the population-weighted average PFAS water concentration: MLE, 95% CI (1 g per ng/L = 1 g per ppt = 1,000 g per ng/ml). Using  substitution for the non-detections and regressions weighted by inverse variance of average birthweight. Crude model: association between PFAS and birthweight only. Adjusted model: adjusted for maternal age (<15, 15–19, 20–24, 25–29, 30–34, 35–39, 40–44, 45–49, ≥50), race (American Indian or Alaska Native, Asian or Pacific Islander, Black or African American, White), education (eighth grade or less; ninth through 12th grade with no diploma; high school graduate or GED completed; some college credit, but not a degree; associate degree; bachelor’s degree; master’s degree; doctorate or professional degree), smoking status (yes, no), and parity (first, second, third and over). Adjusted co-exposure model: adjusted for the co-exposures (the other 3 PFAS and 1,4-dioxane; or 1,4-dioxane only for the model includes the sum of PFAS), and all covariates in the adjusted model.
