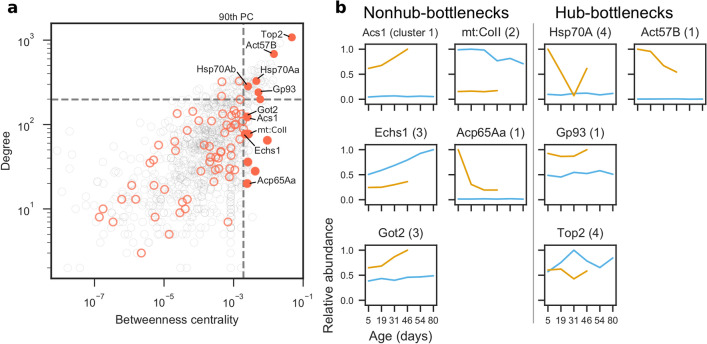
Figure 4.
Analysis of hubs and bottlenecks in the brain protein interaction network. In networks, nodes with high degree are hubs and nodes with high betweenness centrality are bottlenecks. (a) Degree (hub-ness) is plotted against betweenness centrality (bottleneck-ness) in the brain protein interaction network for all proteins identified by IM-DIA-MS (grey circles). Of the significantly altered proteins (red circles), hub-bottleneck (> 90th percentile (PC) for degree and betweenness centrality) and nonhub-bottleneck proteins (> 90th PC for betweenness centrality) are highlighted (filled red circles). (b) Profiles of significantly altered bottleneck proteins implicated in Aβ42 toxicity. Maximum abundances are scaled to 1. Numbers in parentheses denote which cluster from Fig. 2c the protein was in.

