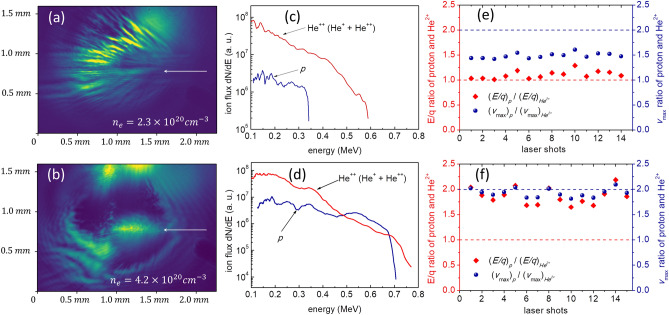
Figure 2.
Plasma density-dependent features of ion acceleration: (a, b) shadowgram images of plasma at a temporal delay of 20 ps. The white arrow indicates the laser propagation direction. The bright light ahead of the arrow originates from the plasma scattered light. (c, d) Kinetic energy spectra of helium and protons. In (e, f) the ratio of kinetic energy (E) per charge (q) between proton and helium in red and ratio of maximum velocity (vmax) between proton and helium in blue are shown at different plasma densities. (a, c, e) correspond to the plasma density of ne = 2.3 × 1020 cm−3, whereas (b, d, f) correspond to higher plasma density ne = 4.2 × 1020 cm−3. The two bright spots on the top section of (b) originate from the reflection from the nozzle tip.

