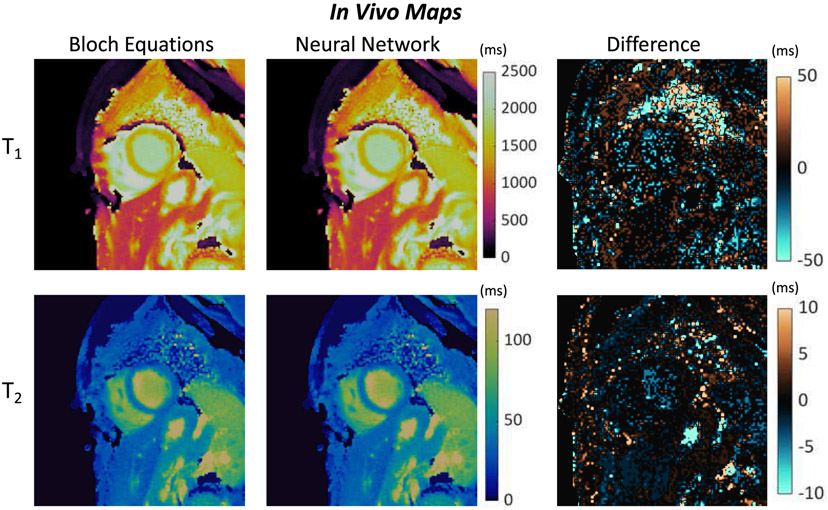
Fig. 11.
Representative short-axis cMRF T1 and T2 maps from a volunteer at 3T. Maps were calculated by matching the measured signals to a dictionary derived from a Bloch equation simulation, as well as a dictionary output by the neural net. Difference maps are also presented (Neural Net – Bloch Equations).

