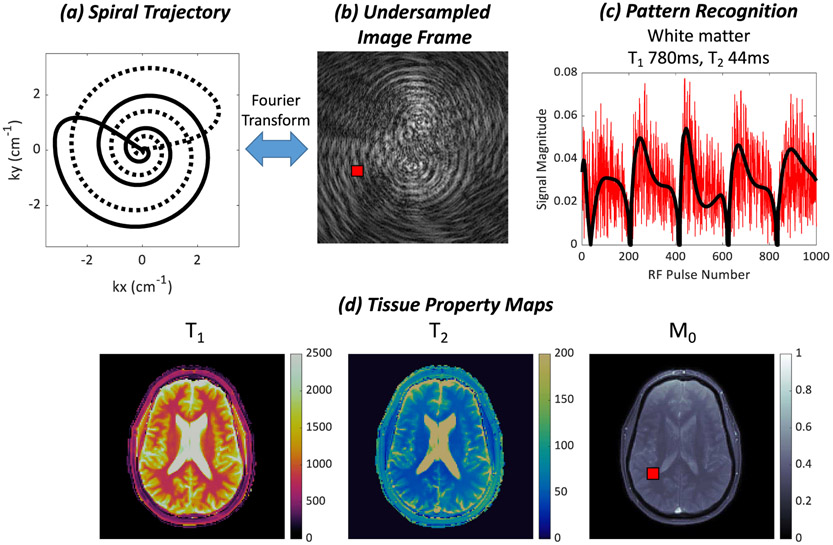
Fig. 2.
(a) MRF data are typically sampled in k-space with a variable density spiral trajectory. The trajectory rotates every TR to sample different parts of k-space, as indicated by the solid and dotted lines. (b) Each image frame is highly undersampled and corrupted by aliasing artifacts. (c) A measured signal evolution from a region in white matter, indicated by the red square in (b) and (d), is plotted in red. The signal is corrupted by noise-like interference due to the undersampling in k-space. The closest matching fingerprint in the dictionary found by dot product matching is plotted in black. (d) Quantitative maps of T1, T2, and M0 are obtained by matching the signal evolution at each pixel to the dictionary.

