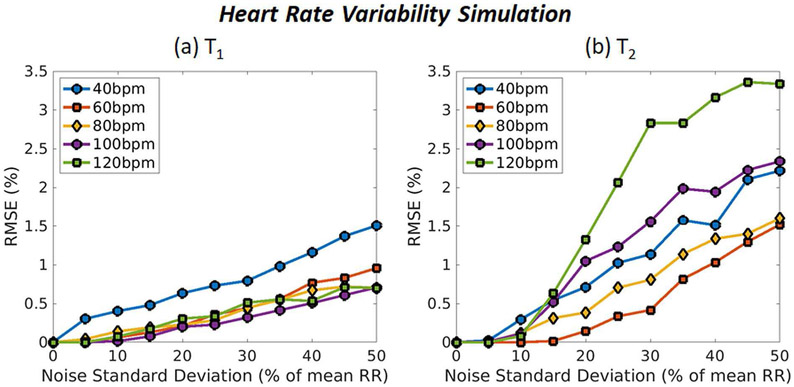
Fig. 8.
Monte Carlo simulation results showing MRF accuracy for myocardial (a) T1 and (b) T2 under variable heart rate conditions. Results are shown for average heart rates of 40, 60, 80, 100, and 120bpm. The x-axis shows the amount of random Gaussian noise that was added to the RR interval timings as a percentage of the average RR interval, and the y-axis shows the normalized RMSE.

