
Figure 2.
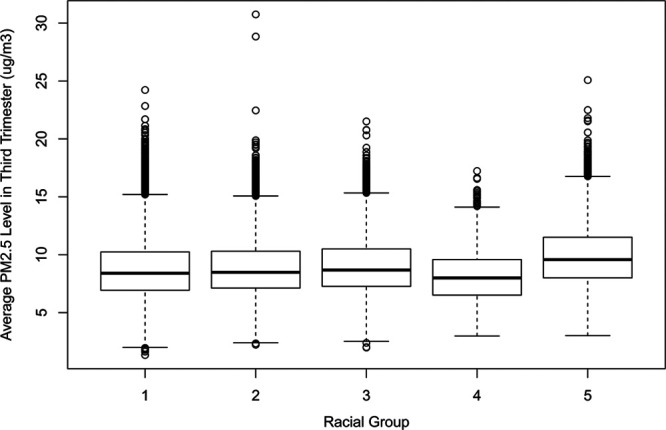
Boxplot distribution of average ambient PM2.5 levels during the third trimester at maternal residential address for various maternal racial groups. Racial groups represent 1: Caucasians, 2: African Americans, 3: Asian and Pacific Islanders, 4: Native Americans, and 5: other nonmissing race, respectively.