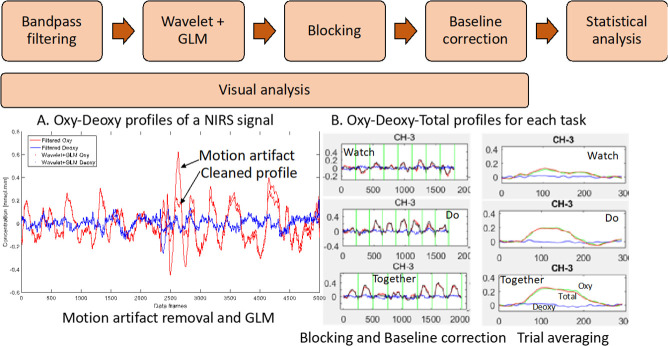
Fig 3.
Data processing workflow (A) Filter, wavelet and GLM of NIRS signal and (B) Trial-by-trial view and average view of Oxy Hb (HbO2), Deoxy Hb (HHb), and Total Hb (HbT) profiles for a given channel. (W, D, T) from 5 secs. before to 24 secs. after start of stimulation. Data have been averaged across trials and participants.

