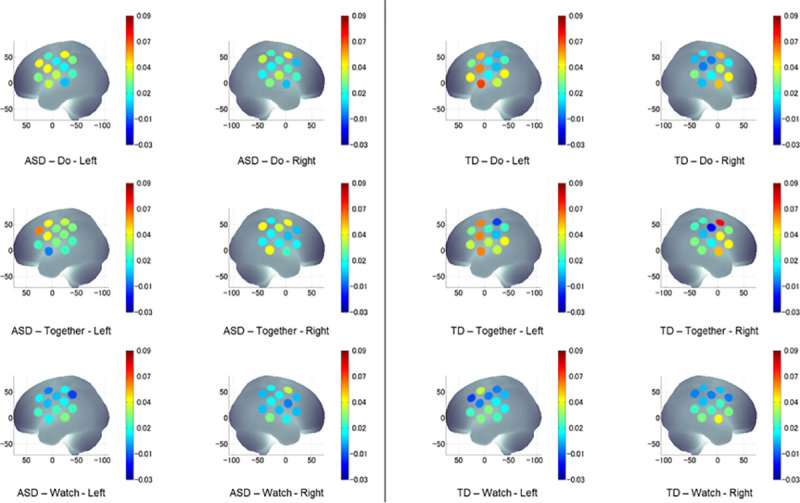
Fig 4.

A visual representation of averaged HbO2 concentration during Watch, Do, and Together conditions in children with ASD (left) and TD children (right). HbO2 values on Y-axis range from 0 indicated by blue to 0.09 indicated by red and shades in between.
