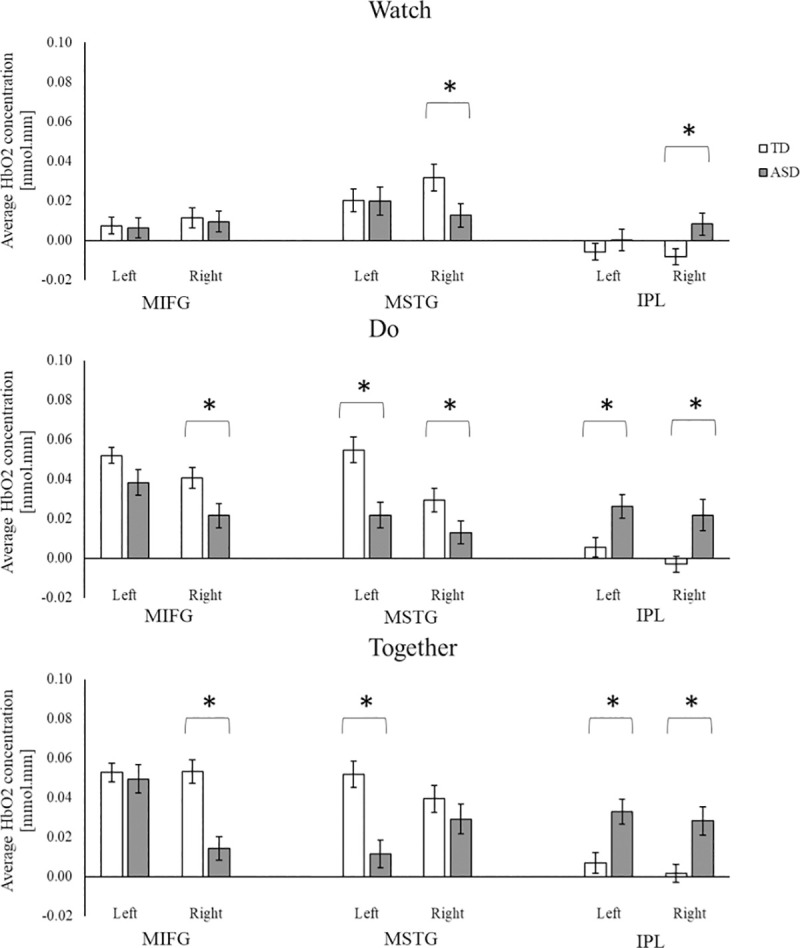
Fig 5. Group differences in HbO2 concentration during watch, do, and together conditions.

*indicates significant differences (i.e., p < 0.05 and survived for FDR correction) between the ASD and TD groups.

*indicates significant differences (i.e., p < 0.05 and survived for FDR correction) between the ASD and TD groups.