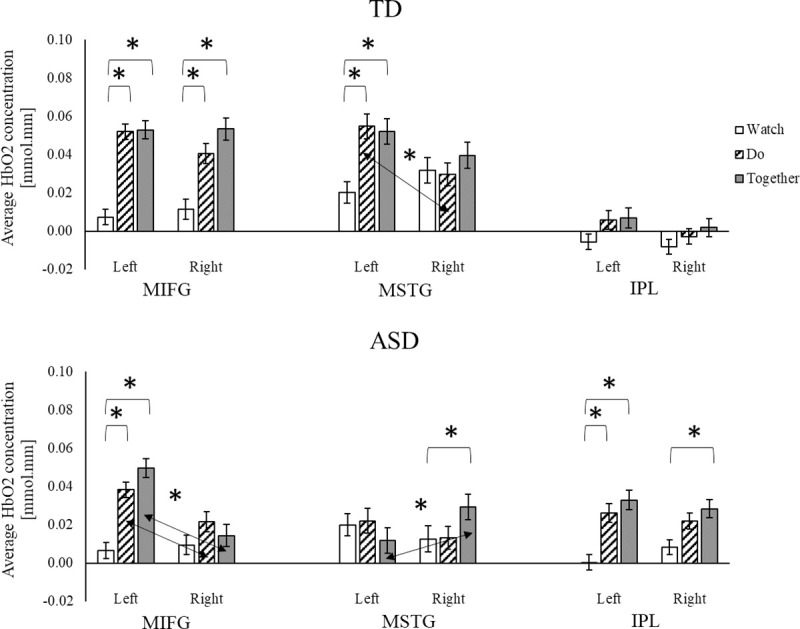
Fig 6. Conditional and hemispheric differences in HbO2 concentration for TD children, and children with ASD.

* indicates conditional differences with p < 0.05 and surviving FDR corrections. ↔ and * indicate significant hemispheric differences with p < 0.05 and surviving FDR corrections.
