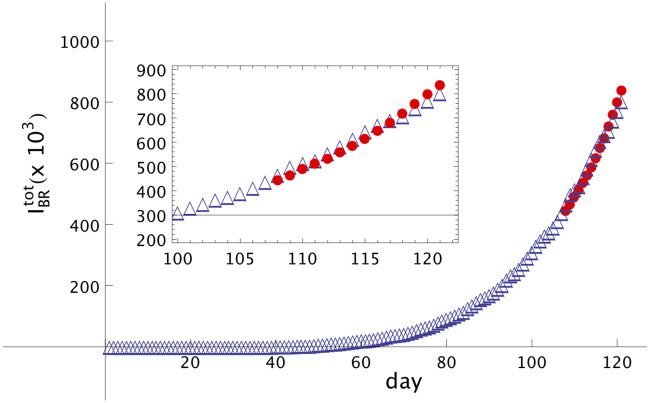
Fig 2. Modelling of Covid-19 dissemination in Brazil.
Total number of people infected by Covid-19 in Brazil, , as function of the number of days, starting from February 12th, indicated as number 1. Empty triangles (red) are real data and full circles (red) are the forecast from day 107, May 28th, until day 121, June 11th. α = 1.01 and β = 0.17. Notice that the curve increases faster than a linear one. In the inset we show a shorter interval, from day 100 up to day 121.

