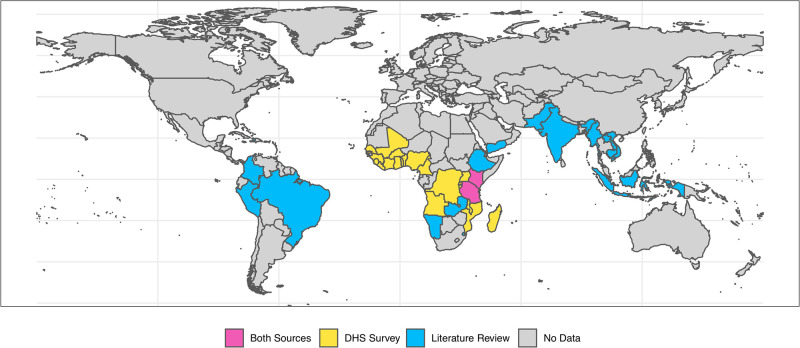
Fig 1. Global map highlighting the geographic distribution of countries where the data used in the statistical analysis of the DHS data and the meta-analysis were collected.
The map of the world is shown with country boundaries demarcated by black lines. Countries where DHS data were available are shown in yellow (n = 23), all in the African region. Countries across the American, African, Middle Eastern, and Asian regrions in blue contributed at least 1 study included in the meta-analysis (n = 20). Two countries shown in pink were represented in both analyses. The world map was obtained from the rnaturalearch R package (version 0.1). DHS, demographic health survey.

