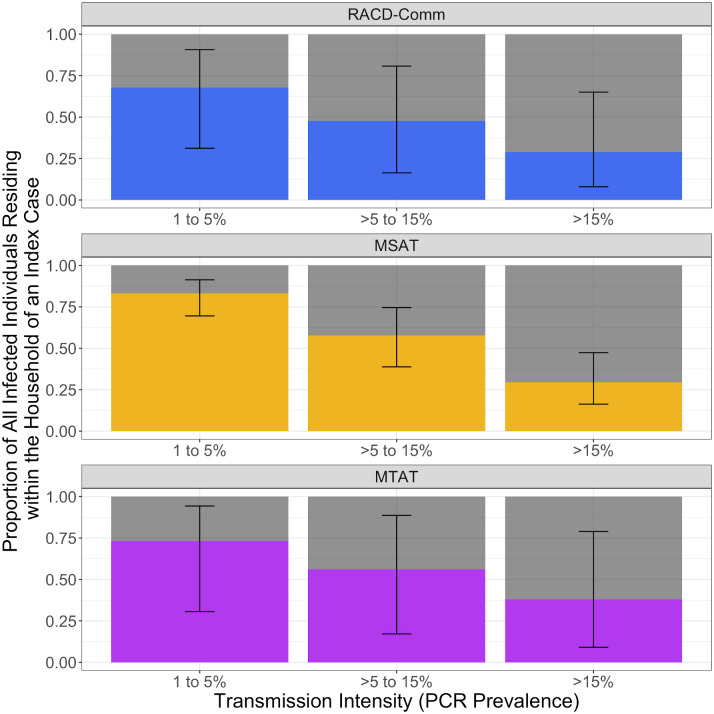
Fig 4. Bar graphs representing the results from the simulated data showing the proportion of all infections in a community that would likely be detected if RACD, MSAT, or MTAT strategies were employed.
Each panel shows the results for a different reactive strategy with bars ordered by transmission strata according to the PCR prevalence in a community of 1,000 people (e.g., 1% to 5%, >5% to 15%, and >15%). The height of each bar represents the total number of infections within a community, with the colour representing the proportion of infections that would be targeted according to each strategy (black bars corresponding to the 95% CI) with the grey section showing the infections that would be missed. MSAT, Mass Screen and Treat; MTAT, Mass Test and Treat; RACD, Reactive Case Detection.

