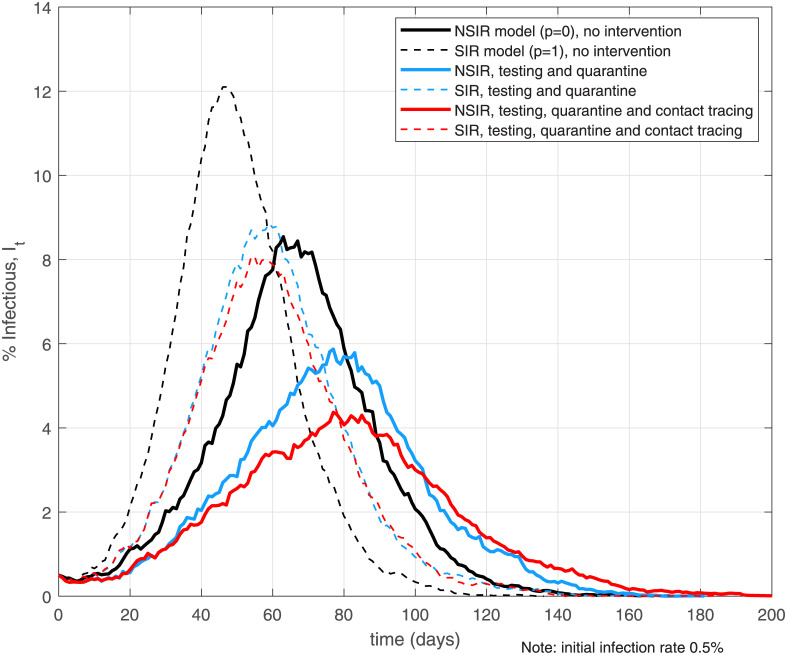
Fig 3. No intervention, mass testing, quarantine and contact tracing.
Notes: the black lines assume no policy interventions or behavioral responses. The light blue lines assume mass testing rate θ = 0.05 and putting positive cases (state P) in quarantine, network Q. The red lines add contact tracing at rate ϕ = 0.1 to the testing and quarantine setting.

