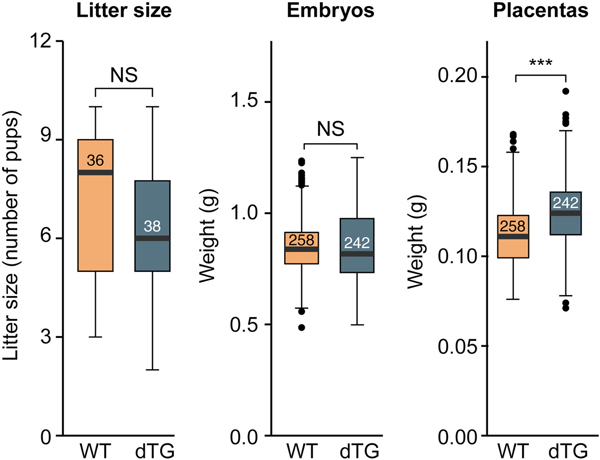
Fig. 2: The effect of C19MC transgene overexpression on litter size and feto-placental weight.
Measurements, shown as box-plots, were performed at E17.5, and include litter size (WT, n=36; dTG, n=38), embryo weight, and placenta weight (WT, n=258; dTG, n=242). The bottom and top edges indicate the 25th and 75th percentiles, respectively. The numbers inside the boxes represent the number of observations. Statistical significance was determined using a t-test. NS, non-significant, * denotes p<0.05, ** denotes p<0.01, *** denotes p<0.001.

