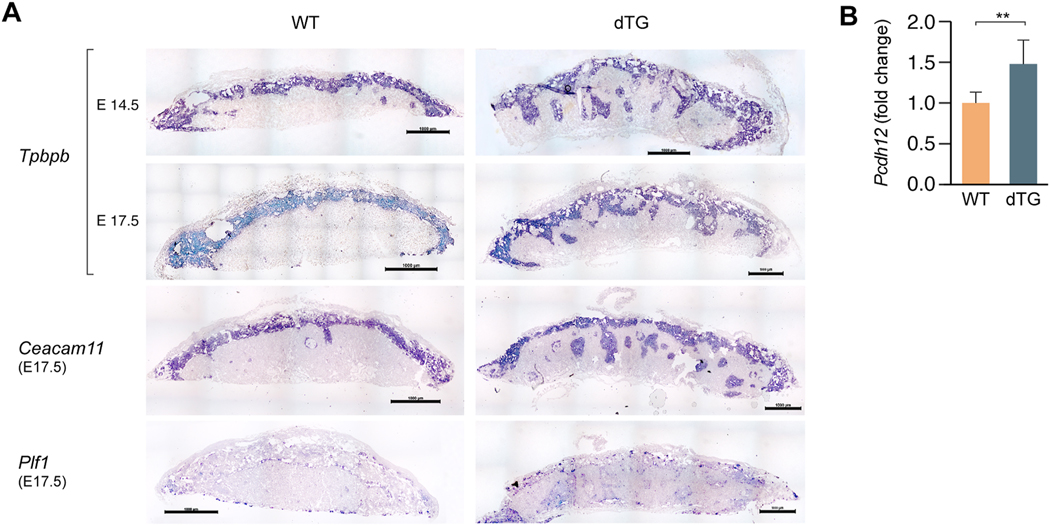
Fig. 4: In situ hybridization for delineation of the placental junctional zone.
(A) A Tpbpb riboprobe shows invaginations of the junctional zone in the dTG labyrinthine layer at E14.5 and E17.5; spongiotrophoblast-specific riboprobe Ceacam11 exhibits a similar pattern. A riboprobe against Plf1 delineates the distribution of E17.5 trophoblast giant cells in WT and dTG placentas. Scale bar=1000 μm. Sense probes were used as negative controls showed no signal (not shown). (B) RT-qPCR of Pcdh12 in WT and dTG placentas. The relative expression level is presented as fold change in dTG vs WT placenta. The bars represent the mean relative expression in WT (n=3) vs dTG (n=14) placentas. P<0.01, determined by t-test.

