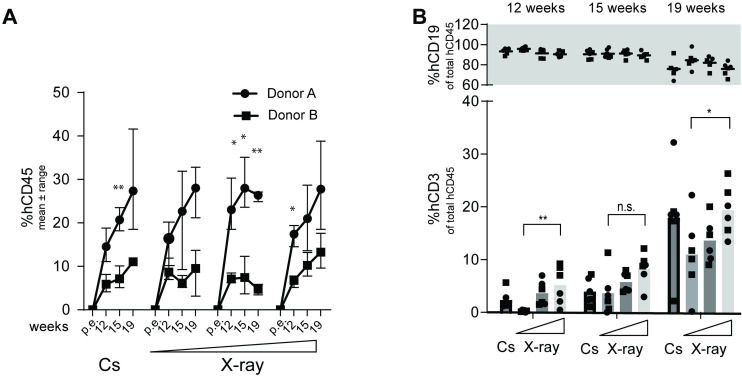
Fig 2. Human chimerization in peripheral blood depicted for each donor as well as for each source of irradiation and dose.
(A) Percentage (mean ± range) of peripheral cell chimerization (based on fraction of all WBCs detected) (⚫Donor A, ⬛Donor B). Statistical significant differences between donors for each time points were calculated using multiple t-tests with Holm-Sidaks correction for multiple comparisons. Asterisks are depicted above significant differences. (B) Percentage (mean ± range) of either peripheral B cells (top panel) or T cells (bottom panel) (based on fraction of WBCs that express human CD45) presented as a mean of all 6 mice in each radiation group, the two donors combined (⚫Donor A, ⬛Donor B). Relevant statistical comparisons between irradiation groups using Mann-Whitney U tests are depicted above bars.

