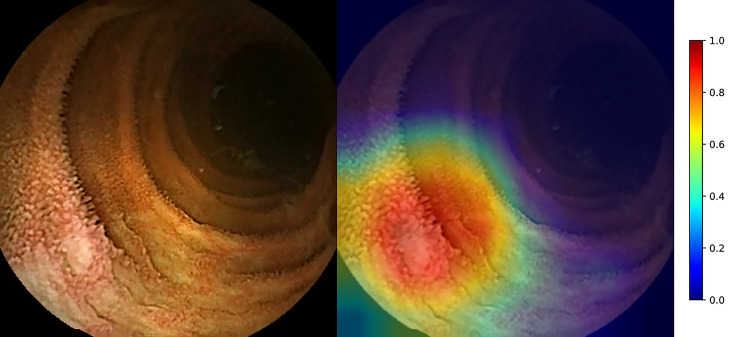
Fig 2. Class activation map of inflamed mucosa.
Jet color map showing the normalized prediction where reddish and bluish colors are close to 1 and 0, respectively (right bar). An ulcer in the left, lower corner of the image is highlighted in red. This figure demonstrates the approximate mechanism of AI.

