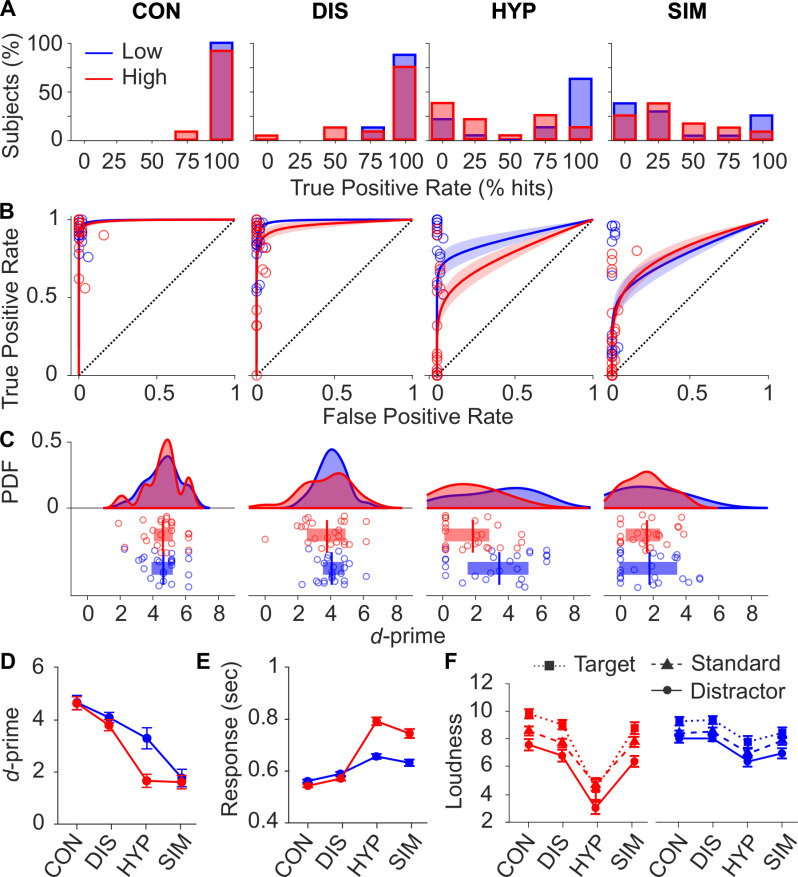
Fig 1.
Behavioral data are depicted separately for low (blue), and highly (red) susceptible participants in control (CON), distraction (DIS), hypnosis (HYP), and simulation (SIM). (A) Histograms of hit rates showing the percentage of subjects in each of the five mutually exclusive hit rate classes (0≤25≤50≤75≤100%). (B) Grandaverage receiver operating characteristic (ROC) curves in the four conditions. Circles mark the empirical true positive (hit) rates plotted against false positive (false alarm) rates of each subject. Shaded areas indicate the 95% CI. A curve above the dotted diagnol represents a discrimination better than random. (C) Probability density function (PDF) and scatter plot of estimated d-primes. Vertical lines and boxes mark the mean and interquartile range (difference between 75th and 25th percentiles) of estimated d-primes, respectively. (D) Line plot of d-prime (mean ± within-subject standard error). (E) Target response time (mean ± within-subject standard error). (F) Loudness rating of target, standard, and distractor stimuli (mean ± within-subject standard error).

