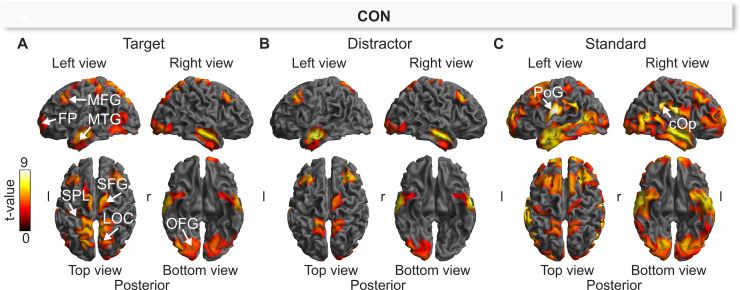
Fig 4. Source-level effects of the auditory Three-Stimulus-Oddball paradigm during the P3b window (320–470 ms) in control (CON) for the target (A), distractor (B), and standard (C).
The cortical images show sources that were significantly different from zero (one-sample t-test). The labeled brain structures refer to the cluster peaks. l = left; r = right; MTG = middle temporal gyrus; FP = frontal pole; SPL = superior parietal lobule LOC = lateral occipital cortex; OFG = occipital fusiform gyrus; SFG = superior frontal gyrus; PoG = postcentral gyrus; cOP = central opercular cortex. The summary statistic images of the cortical mesh were thresholded at uncorrected p = .001 with FWE correction at cluster-level, p = .05, based on random field theory.

